
cattanimarco/grafici-gfx
Developer tools이 페이지는 AI로 자동 번역되었습니다. 기술적인 세부 사항은 원문을 확인하세요. 원문 보기
Data visualization library for Arduino driven displays
개요
Grafici-GFX plots data on Arduino displays supporting Adafruit GFX. We can take an array or a function, choose a plotter, and draw the result in a Cartesian or polar window. The same data sources work with lines, areas, bars and scatter plots. In Arduino IDE, open Sketch > Include Library > Manage Libraries, search for Grafici, and install Grafici-GFX with its dependencies. Install the driver for your display as well; the examples below use Adafruit ILI9341. For PlatformIO, add the library and your display driver to your environment's platformio.ini section: Two waves with nearby frequencies sometimes reinforce each other and sometimes cancel. We can see this by adding two sine functions and plotting the result. This sketch uses chip-select pin 10 and data/command pin 9. Change the driver, pins and initialization to match your display. The oscillations become smaller towards the middle, where the waves cancel. The last y in plot.
README
원문 README의 일부입니다. 원문 보기.
Grafici-GFX


Grafici-GFX plots data on Arduino displays supporting Adafruit GFX. We can take an array or a function, choose a plotter, and draw the result in a Cartesian or polar window. The same data sources work with lines, areas, bars and scatter plots.
Installation
In Arduino IDE, open Sketch > Include Library > Manage Libraries, search for Grafici, and install Grafici-GFX with its dependencies. Install the driver for your display as well; the examples below use Adafruit ILI9341.
For PlatformIO, add the library and your display driver to your environment’s platformio.ini section:
lib_deps =
  https://github.com/cattanimarco/Grafici-GFX.git
  adafruit/Adafruit ILI9341
Make two waves beat
Two waves with nearby frequencies sometimes reinforce each other and sometimes cancel. We can see this by adding two sine functions and plotting the result.
This sketch uses chip-select pin 10 and data/command pin 9. Change the driver, pins and initialization to match your display.
#include
#include
#include
#include

Adafruit_ILI9341 gfx{10, 9};
Grafici plot{gfx};

constexpr size_t samples = 96;

float beat(size_t i) {
  const float t = i * (6.2831853f / (samples - 1));
  return 0.5f * (sinf(7.0f * t) + sinf(8.0f * t));
}

DataLinear x(samples);
DataFunction y(samples, beat, {-1.0f, 1.0f});

void setup() {
  gfx.begin();
  gfx.setRotation(3);
  plot.clear_screen();
  plot.set_color_map(parula);
  auto opts = plot_options.set_axis(2, 8, gunpowder).segments(4);
  plot.line(x, y, y, full_screen, opts);
}

void loop() {}
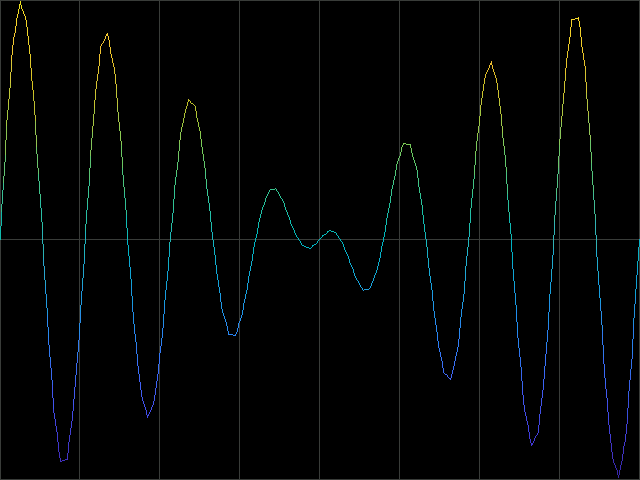
The oscillations become smaller towards the middle, where the waves cancel. The last y in plot.line(x, y, y) also chooses the color, so height and color tell the same story. We could use a separate source for color, or pass a fixed color such as white.
DataLinear supplies the sample positions. DataFunction evaluates the wave when a plotter reads it; it does not store 96 float samples. Its explicit [-1,1] range keeps the scale fixed and avoids scanning the function to discover its bounds.
Buffered display drivers also need their display-update call after drawing. Adafruit GFX supplies the graphics interface; your display driver handles initialization and transfers.
Change the plotter
추천 도구
다른 키워드를 입력하거나 필터를 제거해 보세요.
설치
npx skillfish add cattanimarco/grafici-gfx