
Data visualization library for Arduino driven displays
Overview
Grafici-GFX plots data on Arduino displays supporting Adafruit GFX. We can take an array or a function, choose a plotter, and draw the result in a Cartesian or polar window. The same data sources work with lines, areas, bars and scatter plots. In Arduino IDE, open Sketch > Include Library > Manage Libraries, search for Grafici, and install Grafici-GFX with its dependencies. Install the driver for your display as well; the examples below use Adafruit ILI9341. For PlatformIO, add the library and your display driver to your environment's platformio.ini section: Two waves with nearby frequencies sometimes reinforce each other and sometimes cancel. We can see this by adding two sine functions and plotting the result. This sketch uses chip-select pin 10 and data/command pin 9. Change the driver, pins and initialization to match your display. The oscillations become smaller towards the middle, where the waves cancel. The last y in plot.
README
Grafici-GFX


Grafici-GFX plots data on Arduino displays supporting Adafruit GFX. We can take an array or a function, choose a plotter, and draw the result in a Cartesian or polar window. The same data sources work with lines, areas, bars and scatter plots.
Installation
In Arduino IDE, open Sketch > Include Library > Manage Libraries, search for Grafici, and install Grafici-GFX with its dependencies. Install the driver for your display as well; the examples below use Adafruit ILI9341.
For PlatformIO, add the library and your display driver to your environment’s platformio.ini section:
lib_deps =
  https://github.com/cattanimarco/Grafici-GFX.git
  adafruit/Adafruit ILI9341
Make two waves beat
Two waves with nearby frequencies sometimes reinforce each other and sometimes cancel. We can see this by adding two sine functions and plotting the result.
This sketch uses chip-select pin 10 and data/command pin 9. Change the driver, pins and initialization to match your display.
#include
#include
#include
#include

Adafruit_ILI9341 gfx{10, 9};
Grafici plot{gfx};

constexpr size_t samples = 96;

float beat(size_t i) {
  const float t = i * (6.2831853f / (samples - 1));
  return 0.5f * (sinf(7.0f * t) + sinf(8.0f * t));
}

DataLinear x(samples);
DataFunction y(samples, beat, {-1.0f, 1.0f});

void setup() {
  gfx.begin();
  gfx.setRotation(3);
  plot.clear_screen();
  plot.set_color_map(parula);
  auto opts = plot_options.set_axis(2, 8, gunpowder).segments(4);
  plot.line(x, y, y, full_screen, opts);
}

void loop() {}
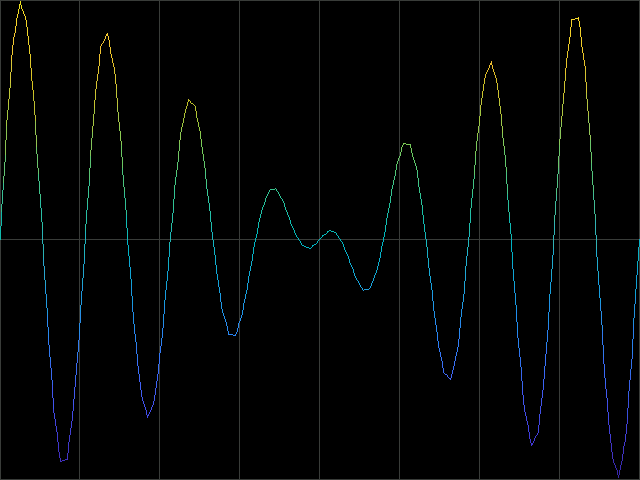
The oscillations become smaller towards the middle, where the waves cancel. The last y in plot.line(x, y, y) also chooses the color, so height and color tell the same story. We could use a separate source for color, or pass a fixed color such as white.
DataLinear supplies the sample positions. DataFunction evaluates the wave when a plotter reads it; it does not store 96 float samples. Its explicit [-1,1] range keeps the scale fixed and avoids scanning the function to discover its bounds.
Buffered display drivers also need their display-update call after drawing. Adafruit GFX supplies the graphics interface; your display driver handles initialization and transfers.
Change the plotter
We can reuse x and y to see the same wave in four different ways. Add this function to the sketch and call draw_plot_types(plot) at the end of setup().
void draw_plot_types(Grafici &plot) {
  plot.clear_screen();
  auto line_window = full_screen.sub_window({0.04f, 0.48f}, {0.54f, 0.96f});
  auto area_window = full_screen.sub_window({0.54f, 0.98f}, {0.54f, 0.96f});
  auto bar_window = full_screen.sub_window({0.04f, 0.48f}, {0.04f, 0.46f});
  auto scatter_window = full_screen.sub_window({0.54f, 0.98f}, {0.04f, 0.46f});
  auto opts = plot_options.set_axis(2, 4, gunpowder);
  DataConstant radius(samples, 0.012f);

  plot.line(x, y, y, line_window, opts);
  plot.area(x, y, y, area_window, opts);
  plot.bar(x, y, y, bar_window, opts.bar_filled(true));
  plot.scatter(x, y, y, radius, scatter_window, opts.scatter_style("o"));
}
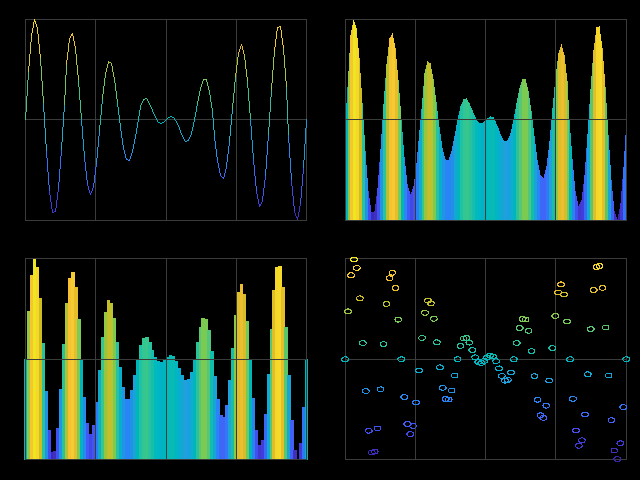
The top row shows a line and a filled area; the bottom row shows bars and scatter markers. The sources have not changed. Each window maps the plot into its own part of the screen, independently of display resolution.
Area plots and bars start at normalized zero. For this wave that is raw -1, the lower bound of its range. The scatter plot takes one more source for marker radius.
Wrap the wave around a circle
A window can also change the projection. In a PolarWindow, normalized x becomes an angle in turns and normalized y becomes a radius. Our beat now draws a flower-like outline.
Keep the same sources and call draw_polar_comparison(plot) at the end of setup():
void draw_polar_comparison(Grafici &plot) {
  plot.clear_screen();
  auto left = full_screen.sub_window({0.04f, 0.48f}, {0.08f, 0.92f});
  auto right = full_screen.sub_window({0.54f, 0.98f}, {0.08f, 0.92f});
  PolarWindow polar({0, 1}, {0, 1}, right);
  auto opts = plot_options.segments(4);
  plot.line(x, y, y, left, opts);
  plot.line(x, y, y, polar, opts);
}
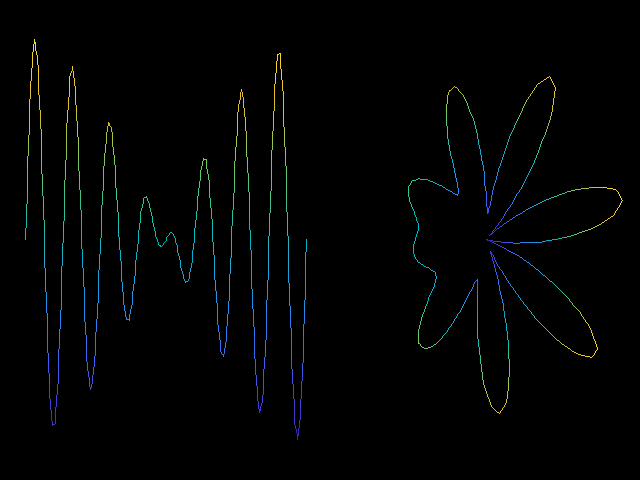
Both pictures use the same samples and colors. Subdivision adds intermediate geometry before projection, helping lines follow curved windows. Increase it when the result needs it; extra segments also mean extra drawing work. A rectangular parent window stretches the polar result to fit that rectangle.
Working with data
DataArray borrows an existing C array. DataFunction computes values, while distributions retain generated samples. Interpolators and histograms build new sources that can feed the same plotters. The examples include arrays, animation, distributions and histograms; the contributor guide walks through a spline.
Each DataNorm sample exposes a raw value through raw() and a normalized position through norm(). Raw measurements can be signed or larger than one. The normalized interface lets sources, colors and windows work together; samples store float values and range bounds.
Keep borrowed arrays, sources and palettes alive while they are used. Inferred bounds are calculated during construction and do not automatically follow later changes. Supply an explicit range when a scale must remain stable. Plot options return modified copies, so assign or pass the result of a fluent chain.
Default DataNorm values and DataNorm::invalid() mean missing data; DataNorm(0.0f) is a valid zero. Missing line and area samples leave gaps. See the boundary contracts for the remaining rules.
Callbacks with captured state
DataFunction uses function pointers by default. On a core providing ``, enable capturing lambdas before including Grafici:
#define GRAFICI_USE_STD_FUNCTION 1
#include
We can then capture a local value, for example [offset](size_t i) -> float { return sinf(i / 10.0f) + offset; }. Use [this] to call a member function. Callbacks are stored by value; referenced objects must remain alive. Set the option consistently across translation units. std::function costs more storage and may allocate, so enable it when those callbacks are needed.
Small boards and displays
Grafici draws primitives without retaining a framebuffer; the display driver may use one. Borrowed arrays and computed sources avoid an extra sample buffer. Distributions, histograms and splines retain data or coefficients, and spline construction needs temporary workspace. The memory guide gives the costs.
Start with modest sample counts and subdivision. Check flash usage for your chosen board and measure peak SRAM and display timing with the actual hardware. The original examples were display-tested on Uno R4 Minima with an Adafruit 2.8-inch TFT Touch Shield. Host regressions and AVR builds provide additional checks; some bundled examples exceed Uno R3 flash without reducing their complexity.
Documentation and tests
The contributor guide explains the modules, includes class and sequence diagrams, and describes how to extend the library. The wiki provides further walkthroughs.
The plot pictures in these guides are generated from their marked code examples by Grafici-Test. That repository owns the image renderer and generated files. See verification to regenerate pictures and choose checks for library changes.
Agent assistance
AGENTS.md points to repository-local skills for library contributions and Arduino use and debugging. They cover the project conventions, normalized interfaces, source lifetimes, build diagnosis and small-board resource limits.
When working in a separate sketch project, give your agent the path to Grafici-GFX/.agents/skills/grafici-arduino/SKILL.md in the installed library and ask it to read that file. Skills inside dependencies may not be discovered automatically; they are plain Markdown and can be read directly.
Contributing
Start with the contributor guide, including its documentation guidelines. Submit changes with the corresponding checks and regenerated pictures when behavior changes. Open issues are the place to discuss features and report problems.
License and dependencies
Grafici-GFX uses the Apache License 2.0. It depends on Adafruit GFX and a display-specific driver such as Adafruit ILI9341.
Recommended Tools
Try a different keyword or remove a filter.
Install
npx skillfish add cattanimarco/grafici-gfx