
cattanimarco/grafici-gfx
Developer toolsこのページは AI により自動翻訳されています。技術的な詳細は原文をご確認ください。 原文を見る
Arduino 駆動ディスプレイのデータ可視化ライブラリ
概要
Grafici-GFXは、Adafruit GFXをサポートするArduinoディスプレイのデータをプロットしています。 配列や関数を取り、プロッターを選択し、カルチェシアンまたは極端ウィンドウで結果を描画することができます。 同じデータソースは、ライン、エリア、バー、スキャッターのプロットで動作します。 Arduino IDE では、Sketch を開きます。 > ライブラリを含める > ライブラリの管理、Grafici を検索し、その依存関係で Grafici-GFX をインストールします。 Adafruit ILI9341 をお使いのディスプレイにドライバーをインストールします。 PlatformIO では、ライブラリと表示ドライバーを環境の platformio.ini セクションに追加します。 近くの周波数を持つ2つの波は時々互いに補強し、時々キャンセルします。 2つの正弦関数を追加し、結果をプロットすることでこれを見ることができます。 このスケッチは、チップ選択ピン10とデータ/コマンドピン9を使用します。 ドライバー、ピン、イニライゼーションを変更して、表示に合わせて変更します。 波が取り消す中央に向かって振動が小さくなります。 最後の y で プロット.
概要(AI 翻訳)
Grafici-GFXは、Adafruit GFXをサポートするArduinoディスプレイのデータをプロットしています。 配列や関数を取り、プロッターを選択し、カルチェシアンまたは極端ウィンドウで結果を描画することができます。 同じデータソースは、ライン、エリア、バー、スキャッターのプロットで動作します。
インストール
Arduino IDE では、[Sketch]> [Include Library]]> [[Manage Libraries]]]を検索し、[Grafici-GFX]を依存関係にインストールします。 Adafruit ILI9341 をお使いのディスプレイにドライバーをインストールします。
PlatformIO では、ライブラリと表示ドライバーを環境の [platformio.ini セクションに追加します。
2つの波を打つ
近くの周波数を持つ2つの波は時々互いに補強し、時々キャンセルします。 2つの正弦関数を追加し、結果をプロットすることでこれを見ることができます。
このスケッチは、チップ選択ピン10とデータ/コマンドピン9を使用します。 ドライバー、ピン、イニライゼーションを変更して、表示に合わせて変更します。
波が取り消す中央に向かって振動が小さくなります。 plot.line(x, y, y)の最後の[y]も色を選ぶので、高さと色は同じ話に伝えます。 whiteのような固定色を渡すか、色別のソースを使うことができます.
このページは AI により自動翻訳されています。技術的な詳細は原文をご確認ください。
README
以下は原文 README の抜粋です。原文を見る。
Grafici-GFX


Grafici-GFX plots data on Arduino displays supporting Adafruit GFX. We can take an array or a function, choose a plotter, and draw the result in a Cartesian or polar window. The same data sources work with lines, areas, bars and scatter plots.
Installation
In Arduino IDE, open Sketch > Include Library > Manage Libraries, search for Grafici, and install Grafici-GFX with its dependencies. Install the driver for your display as well; the examples below use Adafruit ILI9341.
For PlatformIO, add the library and your display driver to your environment’s platformio.ini section:
lib_deps =
  https://github.com/cattanimarco/Grafici-GFX.git
  adafruit/Adafruit ILI9341
Make two waves beat
Two waves with nearby frequencies sometimes reinforce each other and sometimes cancel. We can see this by adding two sine functions and plotting the result.
This sketch uses chip-select pin 10 and data/command pin 9. Change the driver, pins and initialization to match your display.
#include
#include
#include
#include

Adafruit_ILI9341 gfx{10, 9};
Grafici plot{gfx};

constexpr size_t samples = 96;

float beat(size_t i) {
  const float t = i * (6.2831853f / (samples - 1));
  return 0.5f * (sinf(7.0f * t) + sinf(8.0f * t));
}

DataLinear x(samples);
DataFunction y(samples, beat, {-1.0f, 1.0f});

void setup() {
  gfx.begin();
  gfx.setRotation(3);
  plot.clear_screen();
  plot.set_color_map(parula);
  auto opts = plot_options.set_axis(2, 8, gunpowder).segments(4);
  plot.line(x, y, y, full_screen, opts);
}

void loop() {}
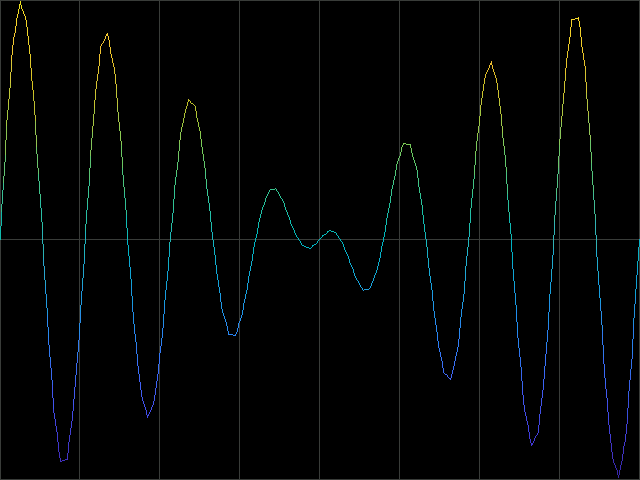
The oscillations become smaller towards the middle, where the waves cancel. The last y in plot.line(x, y, y) also chooses the color, so height and color tell the same story. We could use a separate source for color, or pass a fixed color such as white.
DataLinear supplies the sample positions. DataFunction evaluates the wave when a plotter reads it; it does not store 96 float samples. Its explicit [-1,1] range keeps the scale fixed and avoids scanning the function to discover its bounds.
Buffered display drivers also need their display-update call after drawing. Adafruit GFX supplies the graphics interface; your display driver handles initialization and transfers.
Change the plotter
推奨ツール
別のキーワードを試すか、フィルタを外してください。
インストール
npx skillfish add cattanimarco/grafici-gfx