
mcpspan/mcpspan
Developer toolsこのページは AI により自動翻訳されています。技術的な詳細は原文をご確認ください。 原文を見る
MCP サーバーのオープンソース、セルフホスト型分析
概要
MCP サーバーのオープンソース、セルフホスト型分析。 どのツール、リソース、およびプロンプトがどのクライアント、彼らが答える速度、そしてなぜ彼らが失敗するかを参照してください。 MCP サーバーに 1 行を追加し、ドッカーでダッシュボードを実行し、マシンを離れることはありません。 - ツールの呼び出し、リソースの読み込みとプロンプトが、Claude、Claudeコード、Cursor、VSコード、Codex、ChatGPT、残りのクライアントで取得します。 - ツールごとのメディアと95分のパーセンシー、およびフルディストリビューションは、キャッシュがヒットし、スローパスは1つの平均では非表示にしません。 ・ 各ツールの回答がどれほど大きく、典型的かつ最大のものか: 今のツールで、メガバイトがエージェントのコンテキストを満たし、すべてのレイテンシーチャートをうまく表示します。 - 各セッションは、すべてのツールの定義を読んで、呼び出されるか、またはしないで始まります。 コストをリストするトークンの数と、エージェントが数百のセッションで表示され、決して呼び出されないトークンの数を参照してください.
概要(AI 翻訳)
mcpspanの
MCP サーバーのオープンソース、セルフホスト型分析。 クライアントが使用するツール、リソース、プロンプトを参照してください。 彼らが答える速度、そしてなぜ彼らが失敗するか。
MCP サーバーに 1 行を追加し、[docker compose up]] でダッシュボードを実行します。
決してあなたの機械を残しません。
ライブデモを参照してください。, サンプルデータ: いいえ インストール。
##特徴
-すべてのクライアントからの全ての呼び出し。 ツールの呼び出し、リソースの読み込みとプロンプト Claude、Claudeコード、Cursor、VSコード、 Codex、ChatGPT、残り。
- 何かを意味する応答時間。 ツールごとの媒体および95のパーセント キャッシュがヒットし、遅いパスが非表示にしない 1つの平均の中で。
- サイズを絞って下さい。 各ツールの回答が、典型的な最大の規模である場合 今、megabytes を返すツールはエージェントのコンテキストを埋めながら レイテンシーチャートを全て見る -**エージェントの表示 各セッションは、定義を読むことで始まります すべてのツールの、呼ばれたりしない。 コストをリストするトークンの数を見て、 数百のセッションでエージェントが表示され、決して呼ばれなかったツール。
- **失敗は、離れて言った.
このページは AI により自動翻訳されています。技術的な詳細は原文をご確認ください。
README
以下は原文 README の抜粋です。原文を見る。
mcpspan
Open-source, self-hosted analytics for MCP servers. See which tools, resources and prompts get used, by which client, how fast they answer, and why they fail.
Add one line to your MCP server, run the dashboard with docker compose up,
and nothing ever leaves your machine.
See the live demo, with sample data: nothing to install.
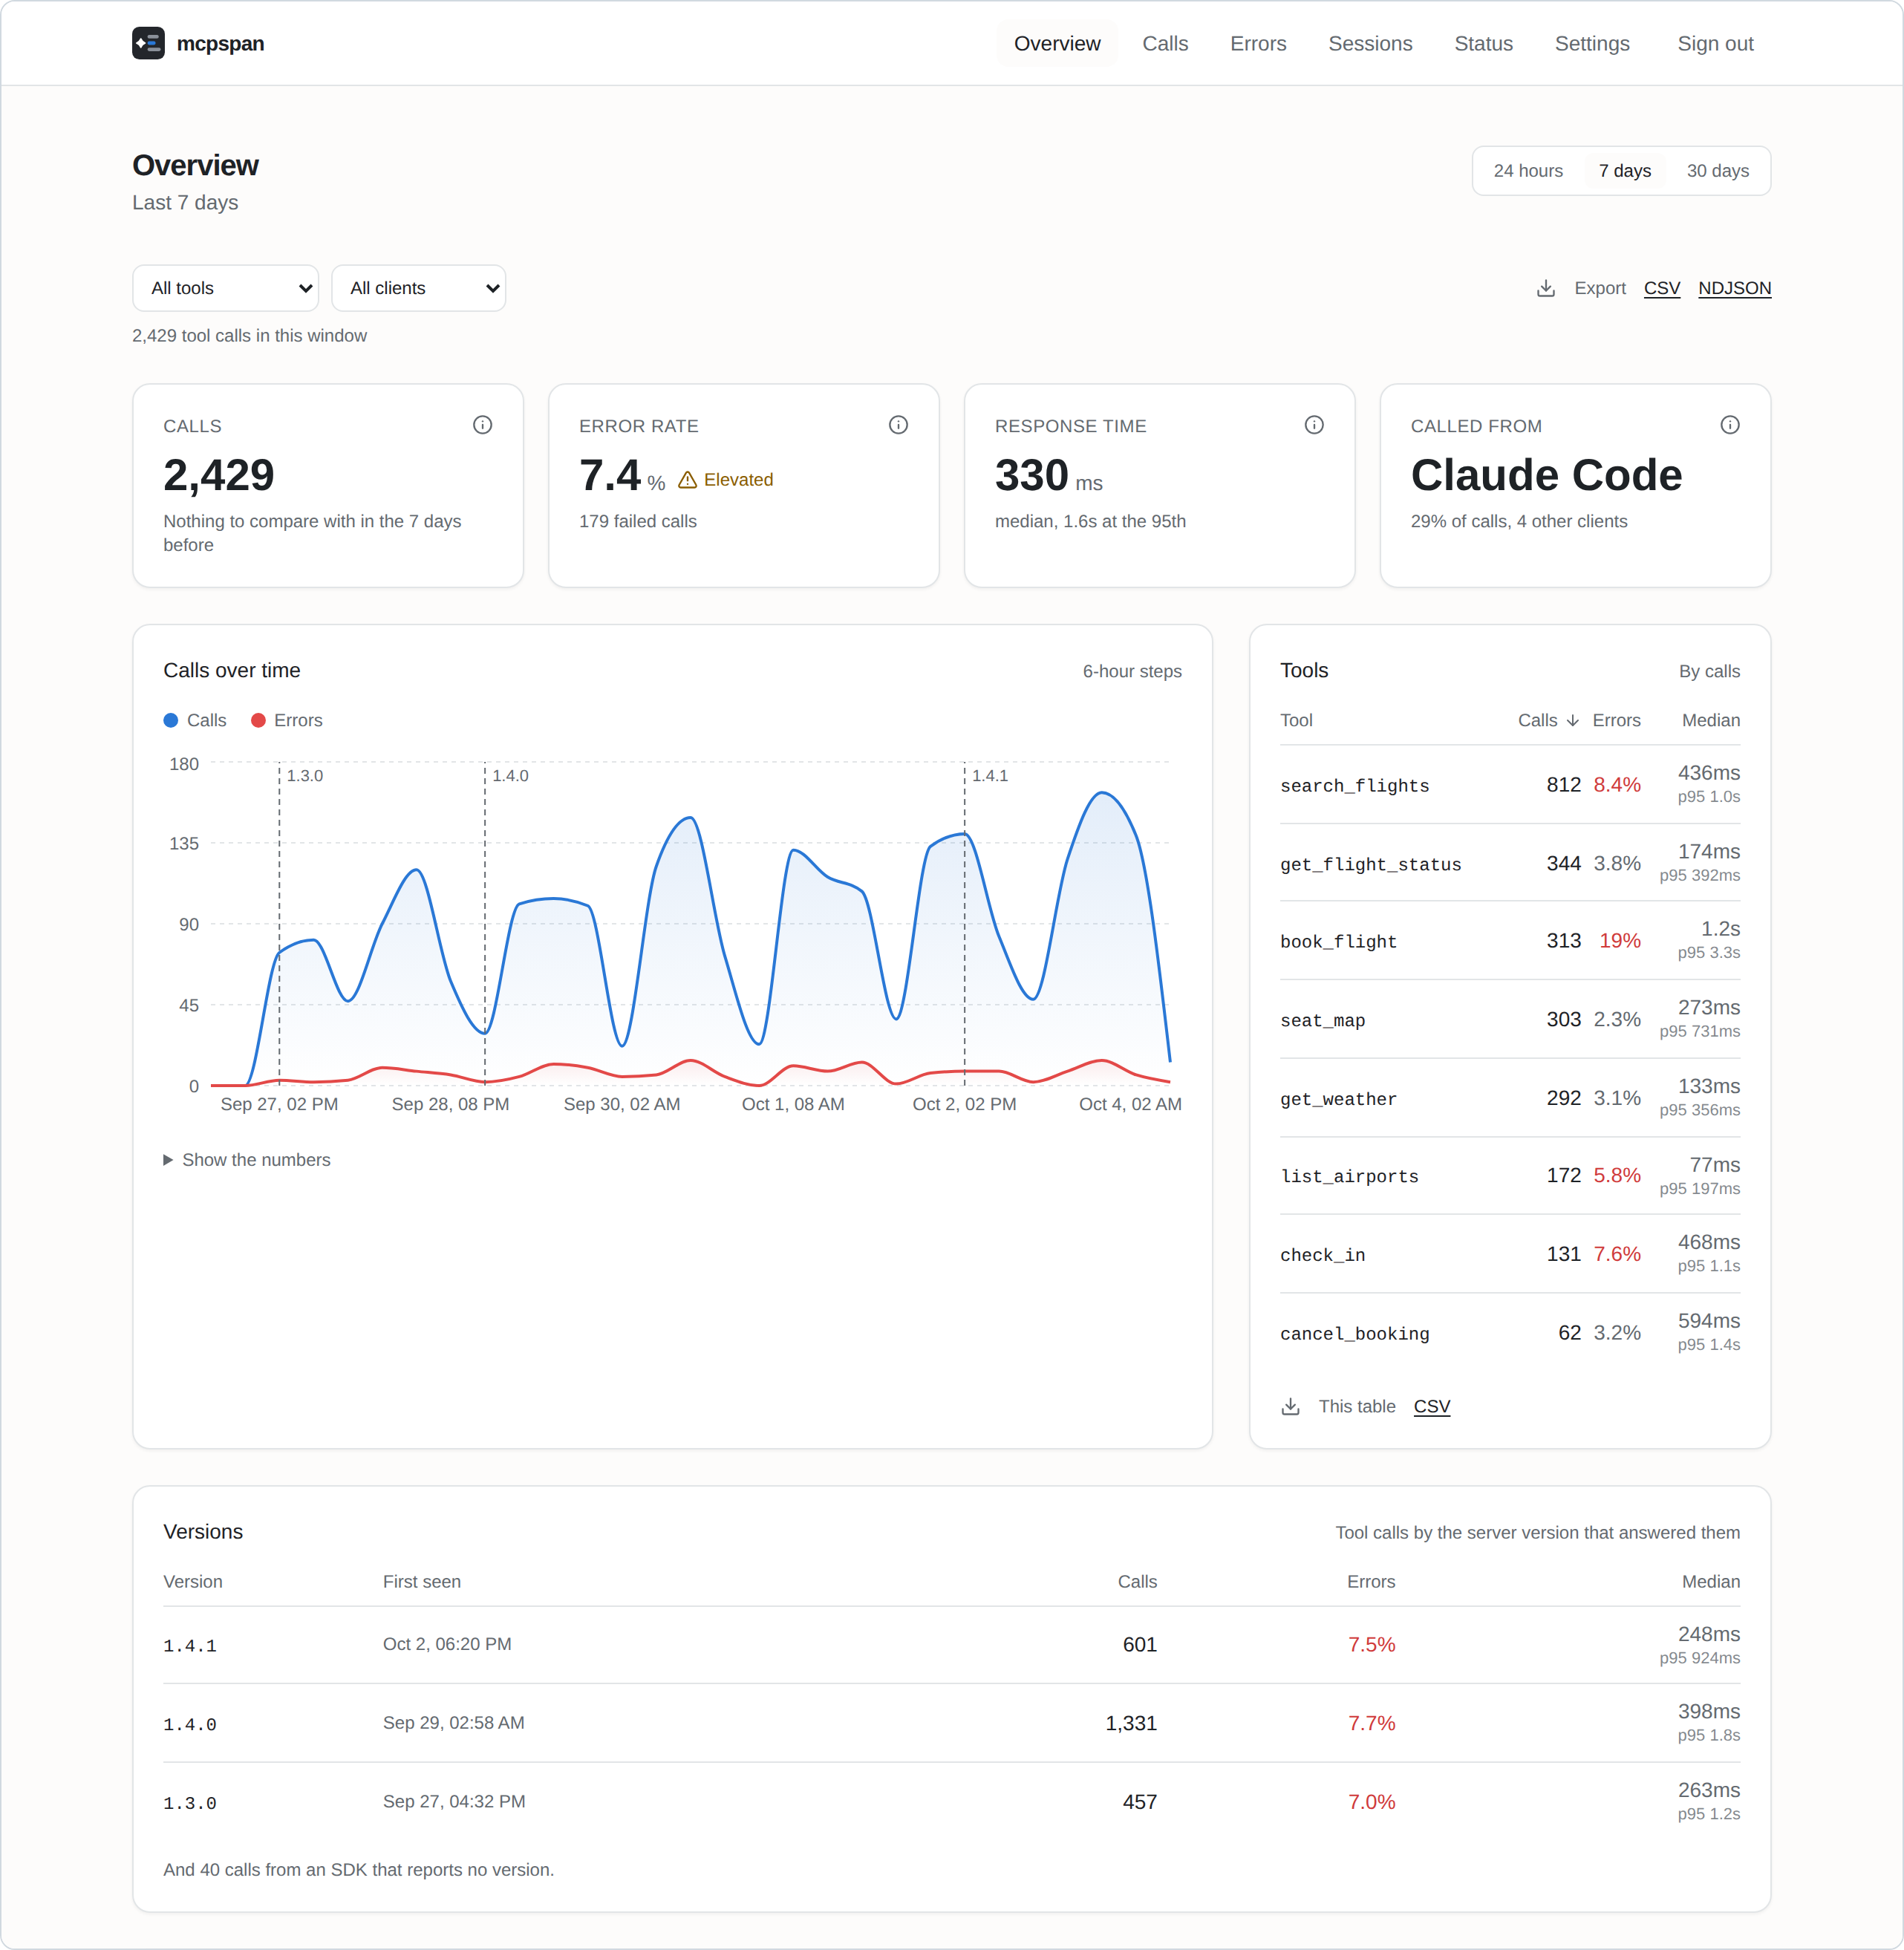
Features
- Every call, from every client. Tool calls, resource reads and prompt gets, with the client that made them: Claude, Claude Code, Cursor, VS Code, Codex, ChatGPT and the rest.
- Response times that mean something. Median and 95th percentile per tool, and the full distribution, so a cache hit and a slow path do not hide inside one average.
- Answer sizes. How large each tool’s answers are, typical and largest: a tool that now and then returns megabytes fills the agent’s context while looking fine on every latency chart.
- What agents are shown. Every session starts by reading the definitions of all your tools, called or not. See how many tokens that list costs, and which tools agents were shown in hundreds of sessions and never called.
- Failures, told apart. A handler that threw, a tool that answered with an error, arguments the server refused and which of them were wrong, and tools that agents asked for but your server does not have: which clients asked, the closest name you do have, and what the agent did next.
- Sessions. Each connection’s calls, step by step, as the agent made them, with the calls an agent repeated with the same arguments marked: a loop that looks fine one call at a time. A tool’s page says which call came right before it repeated or failed, by client.
- Releases. Every call carries the version of your server that answered it; the charts mark where each release began and compare it with the one before. A tool’s own chart also marks where its description or input schema changed, since rewording a description can change how agents use a tool more than a change to its code.
- Alerts to Slack, Discord or any webhook, when errors climb or a server goes quiet, for a whole server or one tool.
- Your data, yours to take. CSV and NDJSON exports of anything you can see, and forwarding to OpenTelemetry for Grafana, Datadog, Honeycomb and the like.
- Private by design. Parameter values never leave your server’s process, and nothing is sent anywhere you did not set up yourself. Error messages, which a tool that runs commands can fill with anything, can be turned off.
インストール
npx mcpspan-lint -- node dist/server.js