
Arduino驱动显示的数据可视化库
概览
Grafici-GFX 在支持 Adafruit GFX 的 Arduino 显示器上绘制数据图。我们可以取一个数组或函数,选择绘图仪,并在笛卡尔或极坐标窗口中绘制结果。同样的数据源也适用于线、面积、条形图和散点图。 在Arduino IDE中,打开Sketch > Include Library>管理库,搜索Grafici,安装Grafici-GFX及其依赖。同时安装显示器驱动程序;以下示例使用Adafruit ILI9341。 对于 PlatformIO,将库和显示驱动程序添加到环境的platformio.ini部分: 两个频率相近的波有时会相互强化,有时相互抵消。我们可以通过添加两个正弦函数并绘制结果来观察这一点。 这个草图使用了芯片选择引脚10和data/command引脚9。更改驱动程序、引脚和初始化以匹配你的显示。 振荡在中间逐渐变小,波会抵消。图中的最后一个y。
概述(AI 翻译)
Grafici-GFX 在支持 Adafruit GFX 的 Arduino 显示器上绘制数据图。我们可以取一个数组或函数,选择绘图仪,并在笛卡尔或极坐标窗口中绘制结果。同样的数据源也适用于线、面积、条形图和散点图。
安装
在Arduino IDE中,打开Sketch >Include Library >Manage Libraries],搜索[Grafici],安装带有依赖的Grafici-GFX。同时安装显示器驱动程序;以下示例使用Adafruit ILI9341。
对于 PlatformIO,将库和你的显示驱动程序添加到环境的 platformio.ini 部分:
让两波浪拍打
两个频率相近的波有时会相互强化,有时相互抵消。我们可以通过添加两个正弦函数并绘制结果来观察这一点。
这个草图使用了芯片选择引脚10和data/command引脚9。更改驱动程序、引脚和初始化以匹配你的显示。
振荡在中间变得更小,波形抵消。plot.line(x, y, y)中的最后一个y也选择颜色,所以高度和颜色讲述的是同一故事。我们可以使用单独的颜色源,或者通过固定颜色,如white。
本页由 AI 翻译,技术细节请以原文为准。
README
以下为原文 README 节选,完整内容请查看原文。
Grafici-GFX


Grafici-GFX plots data on Arduino displays supporting Adafruit GFX. We can take an array or a function, choose a plotter, and draw the result in a Cartesian or polar window. The same data sources work with lines, areas, bars and scatter plots.
Installation
In Arduino IDE, open Sketch > Include Library > Manage Libraries, search for Grafici, and install Grafici-GFX with its dependencies. Install the driver for your display as well; the examples below use Adafruit ILI9341.
For PlatformIO, add the library and your display driver to your environment’s platformio.ini section:
lib_deps =
  https://github.com/cattanimarco/Grafici-GFX.git
  adafruit/Adafruit ILI9341
Make two waves beat
Two waves with nearby frequencies sometimes reinforce each other and sometimes cancel. We can see this by adding two sine functions and plotting the result.
This sketch uses chip-select pin 10 and data/command pin 9. Change the driver, pins and initialization to match your display.
#include
#include
#include
#include

Adafruit_ILI9341 gfx{10, 9};
Grafici plot{gfx};

constexpr size_t samples = 96;

float beat(size_t i) {
  const float t = i * (6.2831853f / (samples - 1));
  return 0.5f * (sinf(7.0f * t) + sinf(8.0f * t));
}

DataLinear x(samples);
DataFunction y(samples, beat, {-1.0f, 1.0f});

void setup() {
  gfx.begin();
  gfx.setRotation(3);
  plot.clear_screen();
  plot.set_color_map(parula);
  auto opts = plot_options.set_axis(2, 8, gunpowder).segments(4);
  plot.line(x, y, y, full_screen, opts);
}

void loop() {}
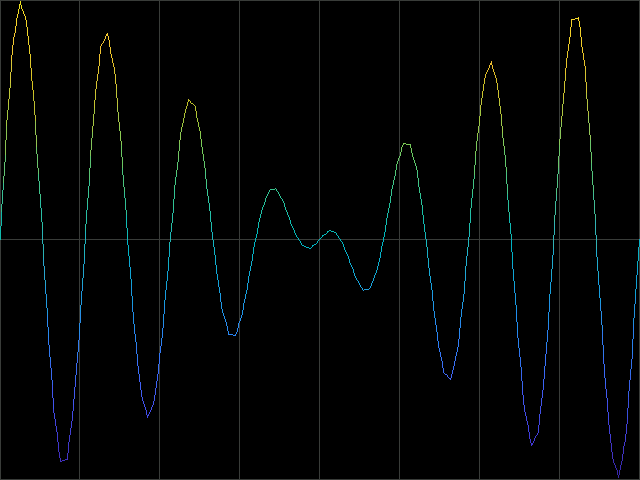
The oscillations become smaller towards the middle, where the waves cancel. The last y in plot.line(x, y, y) also chooses the color, so height and color tell the same story. We could use a separate source for color, or pass a fixed color such as white.
DataLinear supplies the sample positions. DataFunction evaluates the wave when a plotter reads it; it does not store 96 float samples. Its explicit [-1,1] range keeps the scale fixed and avoids scanning the function to discover its bounds.
Buffered display drivers also need their display-update call after drawing. Adafruit GFX supplies the graphics interface; your display driver handles initialization and transfers.
Change the plotter
推荐工具
换一个关键词,或者移除筛选条件。
安装
npx skillfish add cattanimarco/grafici-gfx