
面向MCP服务器的开源自托管分析
概览
面向MCP服务器的开源自托管分析。查看哪些工具、资源和提示被使用,哪个客户端使用,响应速度如何,以及失败的原因。 只要在MCP服务器上加一行,用docker compose up运行仪表盘,机器就不会有任何东西流出。 - 工具调用、资源读取和提示获取,包含创建它们的客户端:Claude、Claude Code、Cursor、VS Code、Codex、ChatGPT 及其他。- 每个工具的中位数和第95百分位数,以及完整的分布,因此缓存点击和慢速路径不会被隐藏在一个平均值内。- 每个工具的回答大小,通常是典型且最大的:一个偶尔返回兆字节、填充代理上下文但显示所有延迟图表都正常的工具。- 每次会话开始时都会阅读所有工具的定义,无论是否调用。查看列出成本的代币数量,以及代理在数百次会话中被展示但从未调用过的工具。
概述(AI 翻译)
麦克斯潘
面向MCP服务器的开源自托管分析。 看看哪些工具、资源和提示被哪些客户使用, 他们回复的速度,以及为何失败。
在你的MCP服务器上添加一行,然后在仪表盘上运行docker compose up。
而且你的机器永远不会离开任何东西。
特色
- 每一个客户的呼叫。 工具调用、资源读取和提示 获得,与创建它们的客户端:Claude,Claude Code,Cursor,VS Code, Codex、ChatGPT以及其他内容。
- 响应时间有意义。 每个工具的中位数和第95百分位, 以及完整的分布,因此缓存命中和慢路径不会隐藏 在一平均范围内。
- 答案大小。 每个工具的答案大小、典型和最大: 一个偶尔返回兆字节的工具填充代理上下文, 在所有延迟表上看起来都正常。
- 显示的代理内容。 每次会话开始时阅读定义 你所有工具,不管是否调用。看看列出的代币有多少,然后 哪些工具:代理在数百次会话中被展示却从未被调用。
- 失败,分开说出来。 一个投掷的操控者,一个用
本页由 AI 翻译,技术细节请以原文为准。
README
以下为原文 README 节选,完整内容请查看原文。
mcpspan
Open-source, self-hosted analytics for MCP servers. See which tools, resources and prompts get used, by which client, how fast they answer, and why they fail.
Add one line to your MCP server, run the dashboard with docker compose up,
and nothing ever leaves your machine.
See the live demo, with sample data: nothing to install.
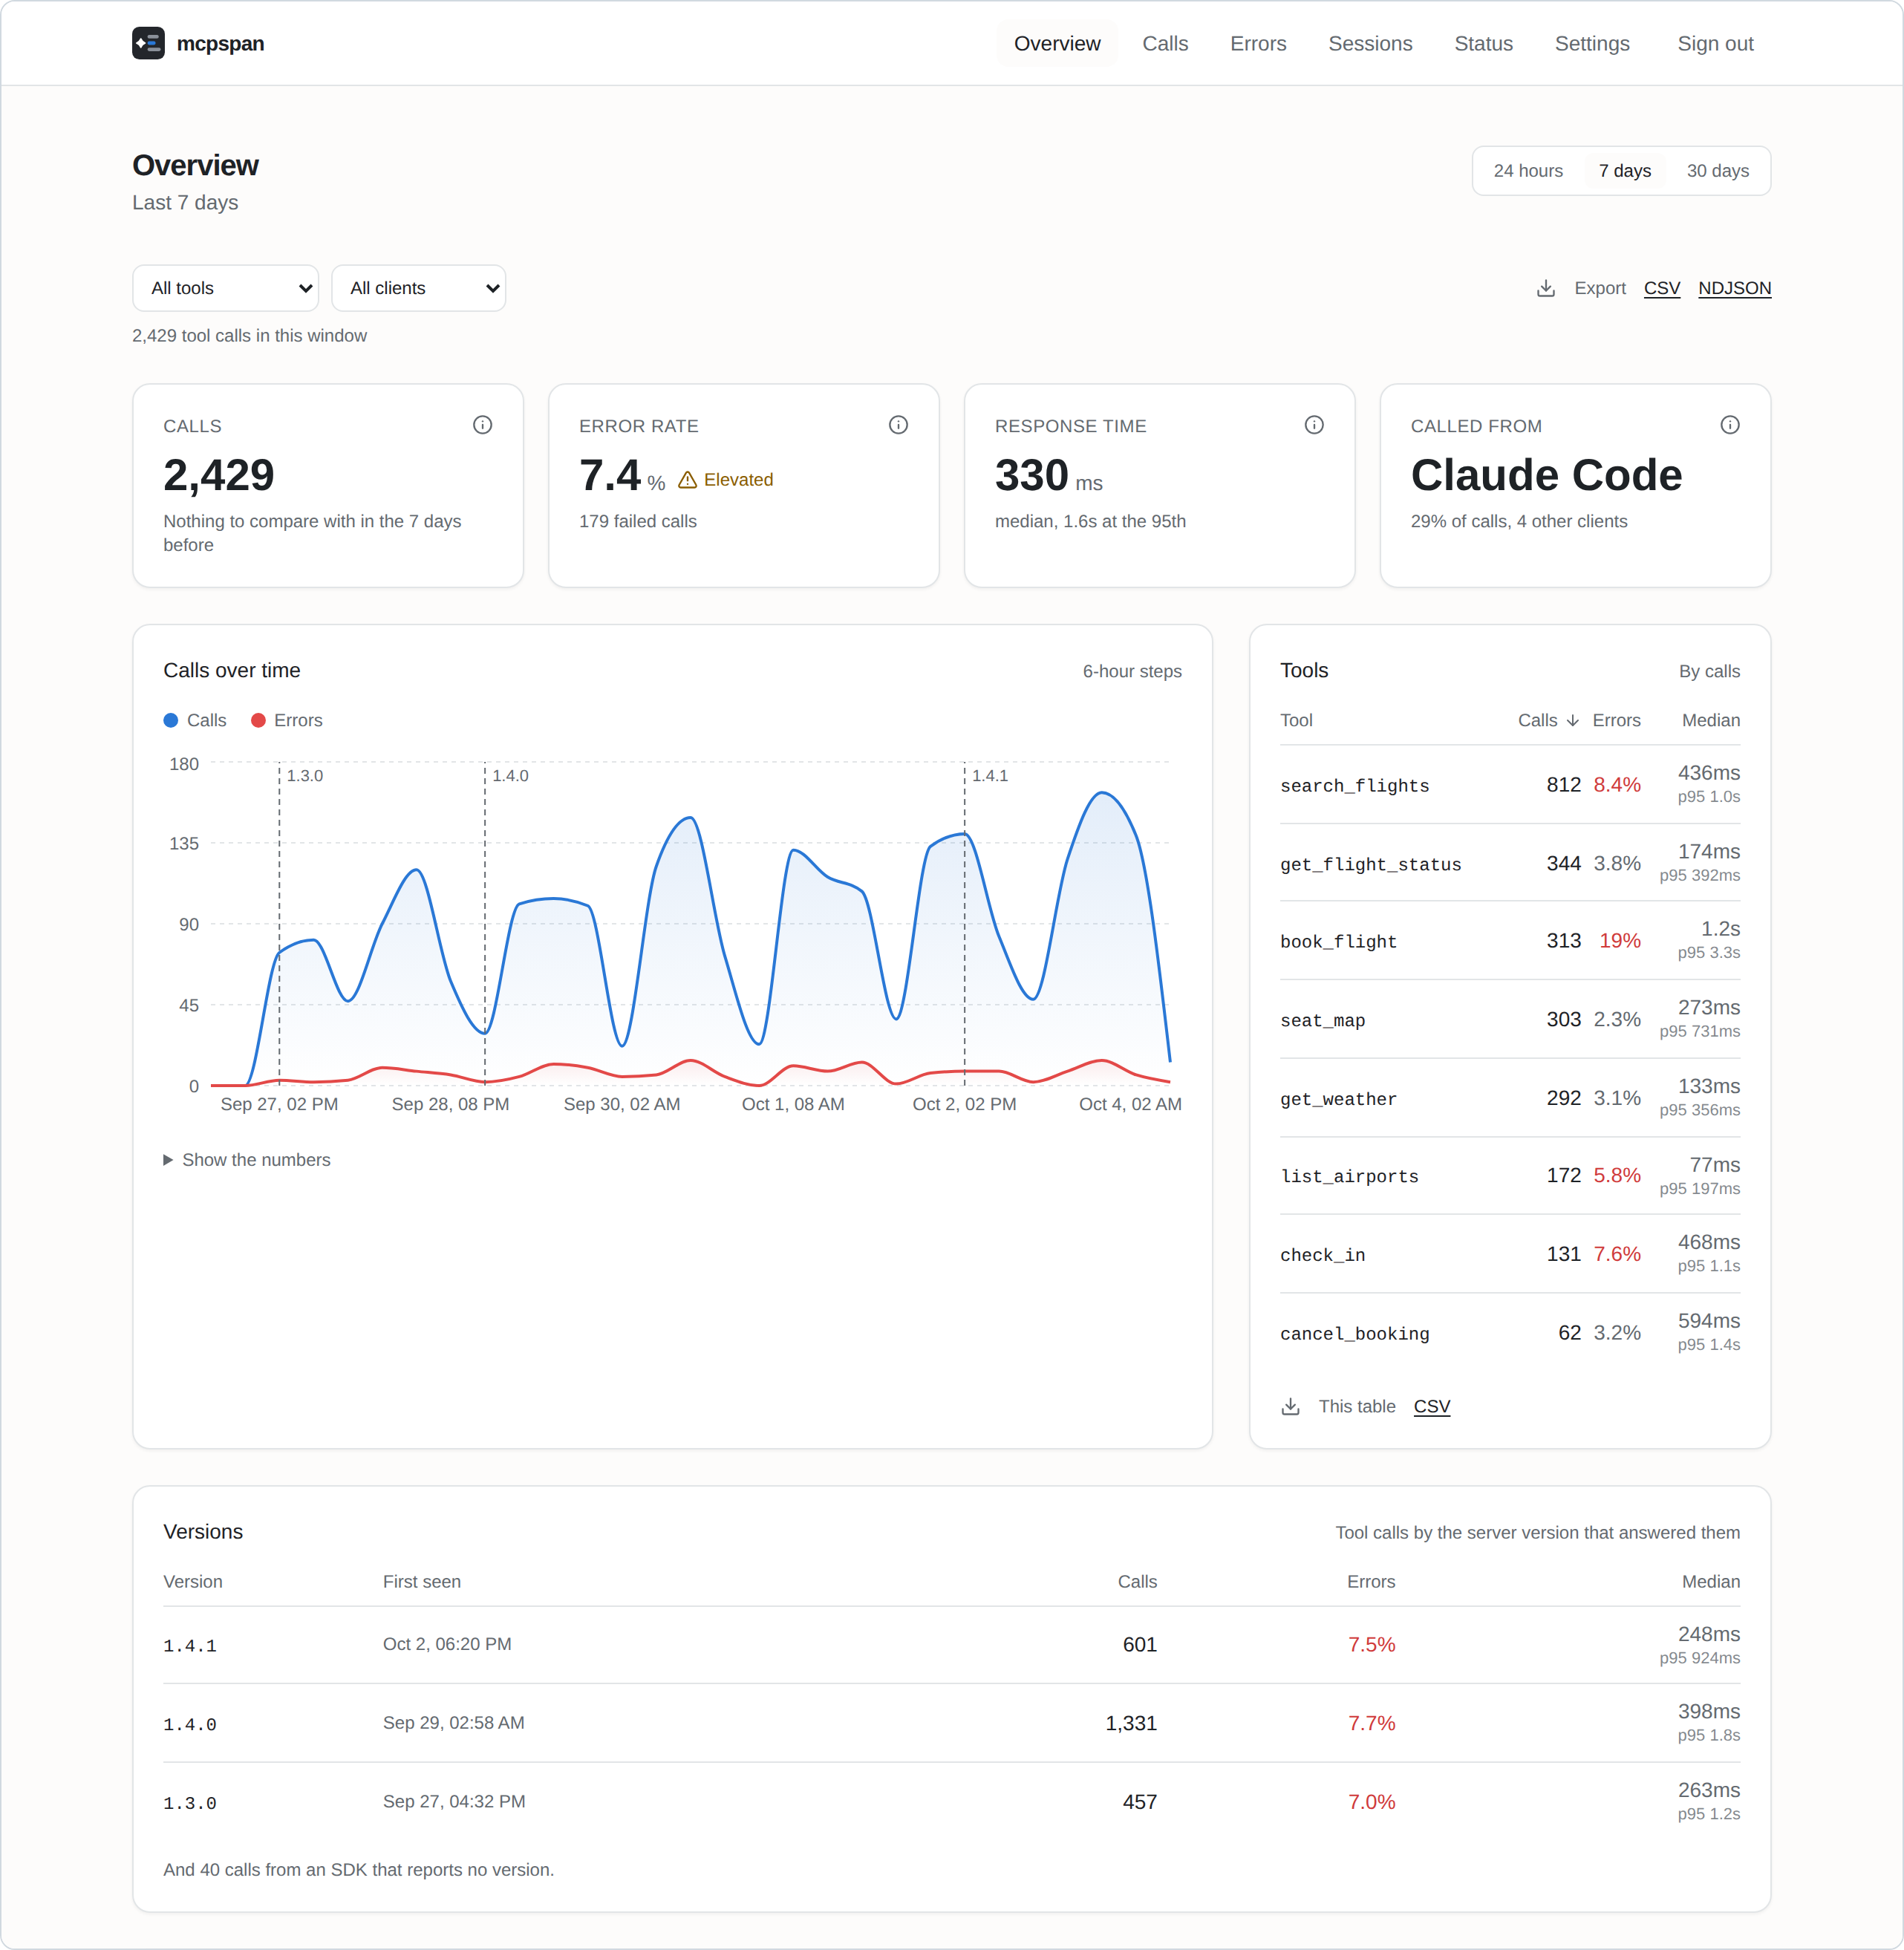
Features
- Every call, from every client. Tool calls, resource reads and prompt gets, with the client that made them: Claude, Claude Code, Cursor, VS Code, Codex, ChatGPT and the rest.
- Response times that mean something. Median and 95th percentile per tool, and the full distribution, so a cache hit and a slow path do not hide inside one average.
- Answer sizes. How large each tool’s answers are, typical and largest: a tool that now and then returns megabytes fills the agent’s context while looking fine on every latency chart.
- What agents are shown. Every session starts by reading the definitions of all your tools, called or not. See how many tokens that list costs, and which tools agents were shown in hundreds of sessions and never called.
- Failures, told apart. A handler that threw, a tool that answered with an error, arguments the server refused and which of them were wrong, and tools that agents asked for but your server does not have: which clients asked, the closest name you do have, and what the agent did next.
- Sessions. Each connection’s calls, step by step, as the agent made them, with the calls an agent repeated with the same arguments marked: a loop that looks fine one call at a time. A tool’s page says which call came right before it repeated or failed, by client.
- Releases. Every call carries the version of your server that answered it; the charts mark where each release began and compare it with the one before. A tool’s own chart also marks where its description or input schema changed, since rewording a description can change how agents use a tool more than a change to its code.
- Alerts to Slack, Discord or any webhook, when errors climb or a server goes quiet, for a whole server or one tool.
- Your data, yours to take. CSV and NDJSON exports of anything you can see, and forwarding to OpenTelemetry for Grafana, Datadog, Honeycomb and the like.
- Private by design. Parameter values never leave your server’s process, and nothing is sent anywhere you did not set up yourself. Error messages, which a tool that runs commands can fill with anything, can be turned off.
安装
npx mcpspan-lint -- node dist/server.js