
mcpspan/mcpspan
Developer tools이 페이지는 AI로 자동 번역되었습니다. 기술적인 세부 사항은 원문을 확인하세요. 원문 보기
MCP 서버에 대한 자체 호스팅 분석
개요
MCP 서버에 대한 자체 호스팅 분석. 도구, 리소스 및 프롬프트가 사용되는 것을보십시오. 즉, 클라이언트가 얼마나 빨리 응답하고 왜 실패합니다. MCP 서버에 한 줄을 추가하고, 도커가 구성하는 대시보드를 실행하고, 결코 당신의 기계를 떠나지 않습니다. - 도구 통화, 리소스 읽기 및 프롬프트는 클라이언트와 함께 다음과 같이 읽습니다. Claude, Claude Code, Cursor, VS Code, Codex, ChatGPT 및 나머지. - 도구 당 미디어 및 95 % ile, 및 전체 배포, 그래서 캐시 히트와 느린 경로는 1 평균 내부를 숨지 않습니다. - - - 각 도구의 답변이 일반적이고 가장 큰 방법 : 도구가 지금이며, Megabytes는 모든 대기 시간 차트에서 벌금을 찾고있는 동안 에이전트의 컨텍스트를 채웁니다. - 모든 세션은 모든 도구의 정의를 읽고, 호출 또는 아닙니다. 목록 비용의 많은 토큰을 참조하고, 도구 에이전트는 수백 세션에 표시되어 결코 호출되지 않았습니다.
개요(AI 번역)
뚱 베어
MCP 서버에 대한 자체 호스팅 분석. 도구, 리소스 및 프롬프트가 사용되었는지 확인하십시오. 그들이 대답하는 방법, 왜 그들은 실패.
MCP 서버에 한 줄을 추가하면 대시보드를 docker compose up로 실행합니다.
그리고 아무 것도 당신의 기계를 떠난다.
** 라이브 데모 **, 샘플 데이터 : 아무것도 설치.
특징
- 모든 통화, 모든 클라이언트에서. 도구 호출, 리소스 읽기 및 신속한 을 얻, 그 만든 클라이언트와 함께: Claude, Claude Code, Cursor, VS Code, Codex, ChatGPT 및 나머지.
- ** 무언가를 의미하는 시간 응답. ** 도구 당 미디어 및 95 % ile, 그리고 전체 배포, 그래서 캐시 히트와 느린 경로는 숨길 1개의 평균 안에.
- **Answer 크기. ** 각 도구의 답변이 일반적이고 가장 큰 방법 : 이 도구는 이제 Megabytes가 에이전트의 컨텍스트를 채우고 있습니다. 모든 대기 시간 차트에 잘 찾고 있습니다.
- ** 어떤 에이전트가 표시됩니다. ** 각 세션은 정의를 읽고 모든 도구, 호출 또는하지. 많은 토큰을 찾는 방법 어떤 도구 에이전트는 수백 세션에 표시되고 결코 호출되지 않았습니다.
- ** 실패, 출발 말했다.
이 페이지는 AI로 자동 번역되었습니다. 기술적인 세부 사항은 원문을 확인하세요.
README
원문 README의 일부입니다. 원문 보기.
mcpspan
Open-source, self-hosted analytics for MCP servers. See which tools, resources and prompts get used, by which client, how fast they answer, and why they fail.
Add one line to your MCP server, run the dashboard with docker compose up,
and nothing ever leaves your machine.
See the live demo, with sample data: nothing to install.
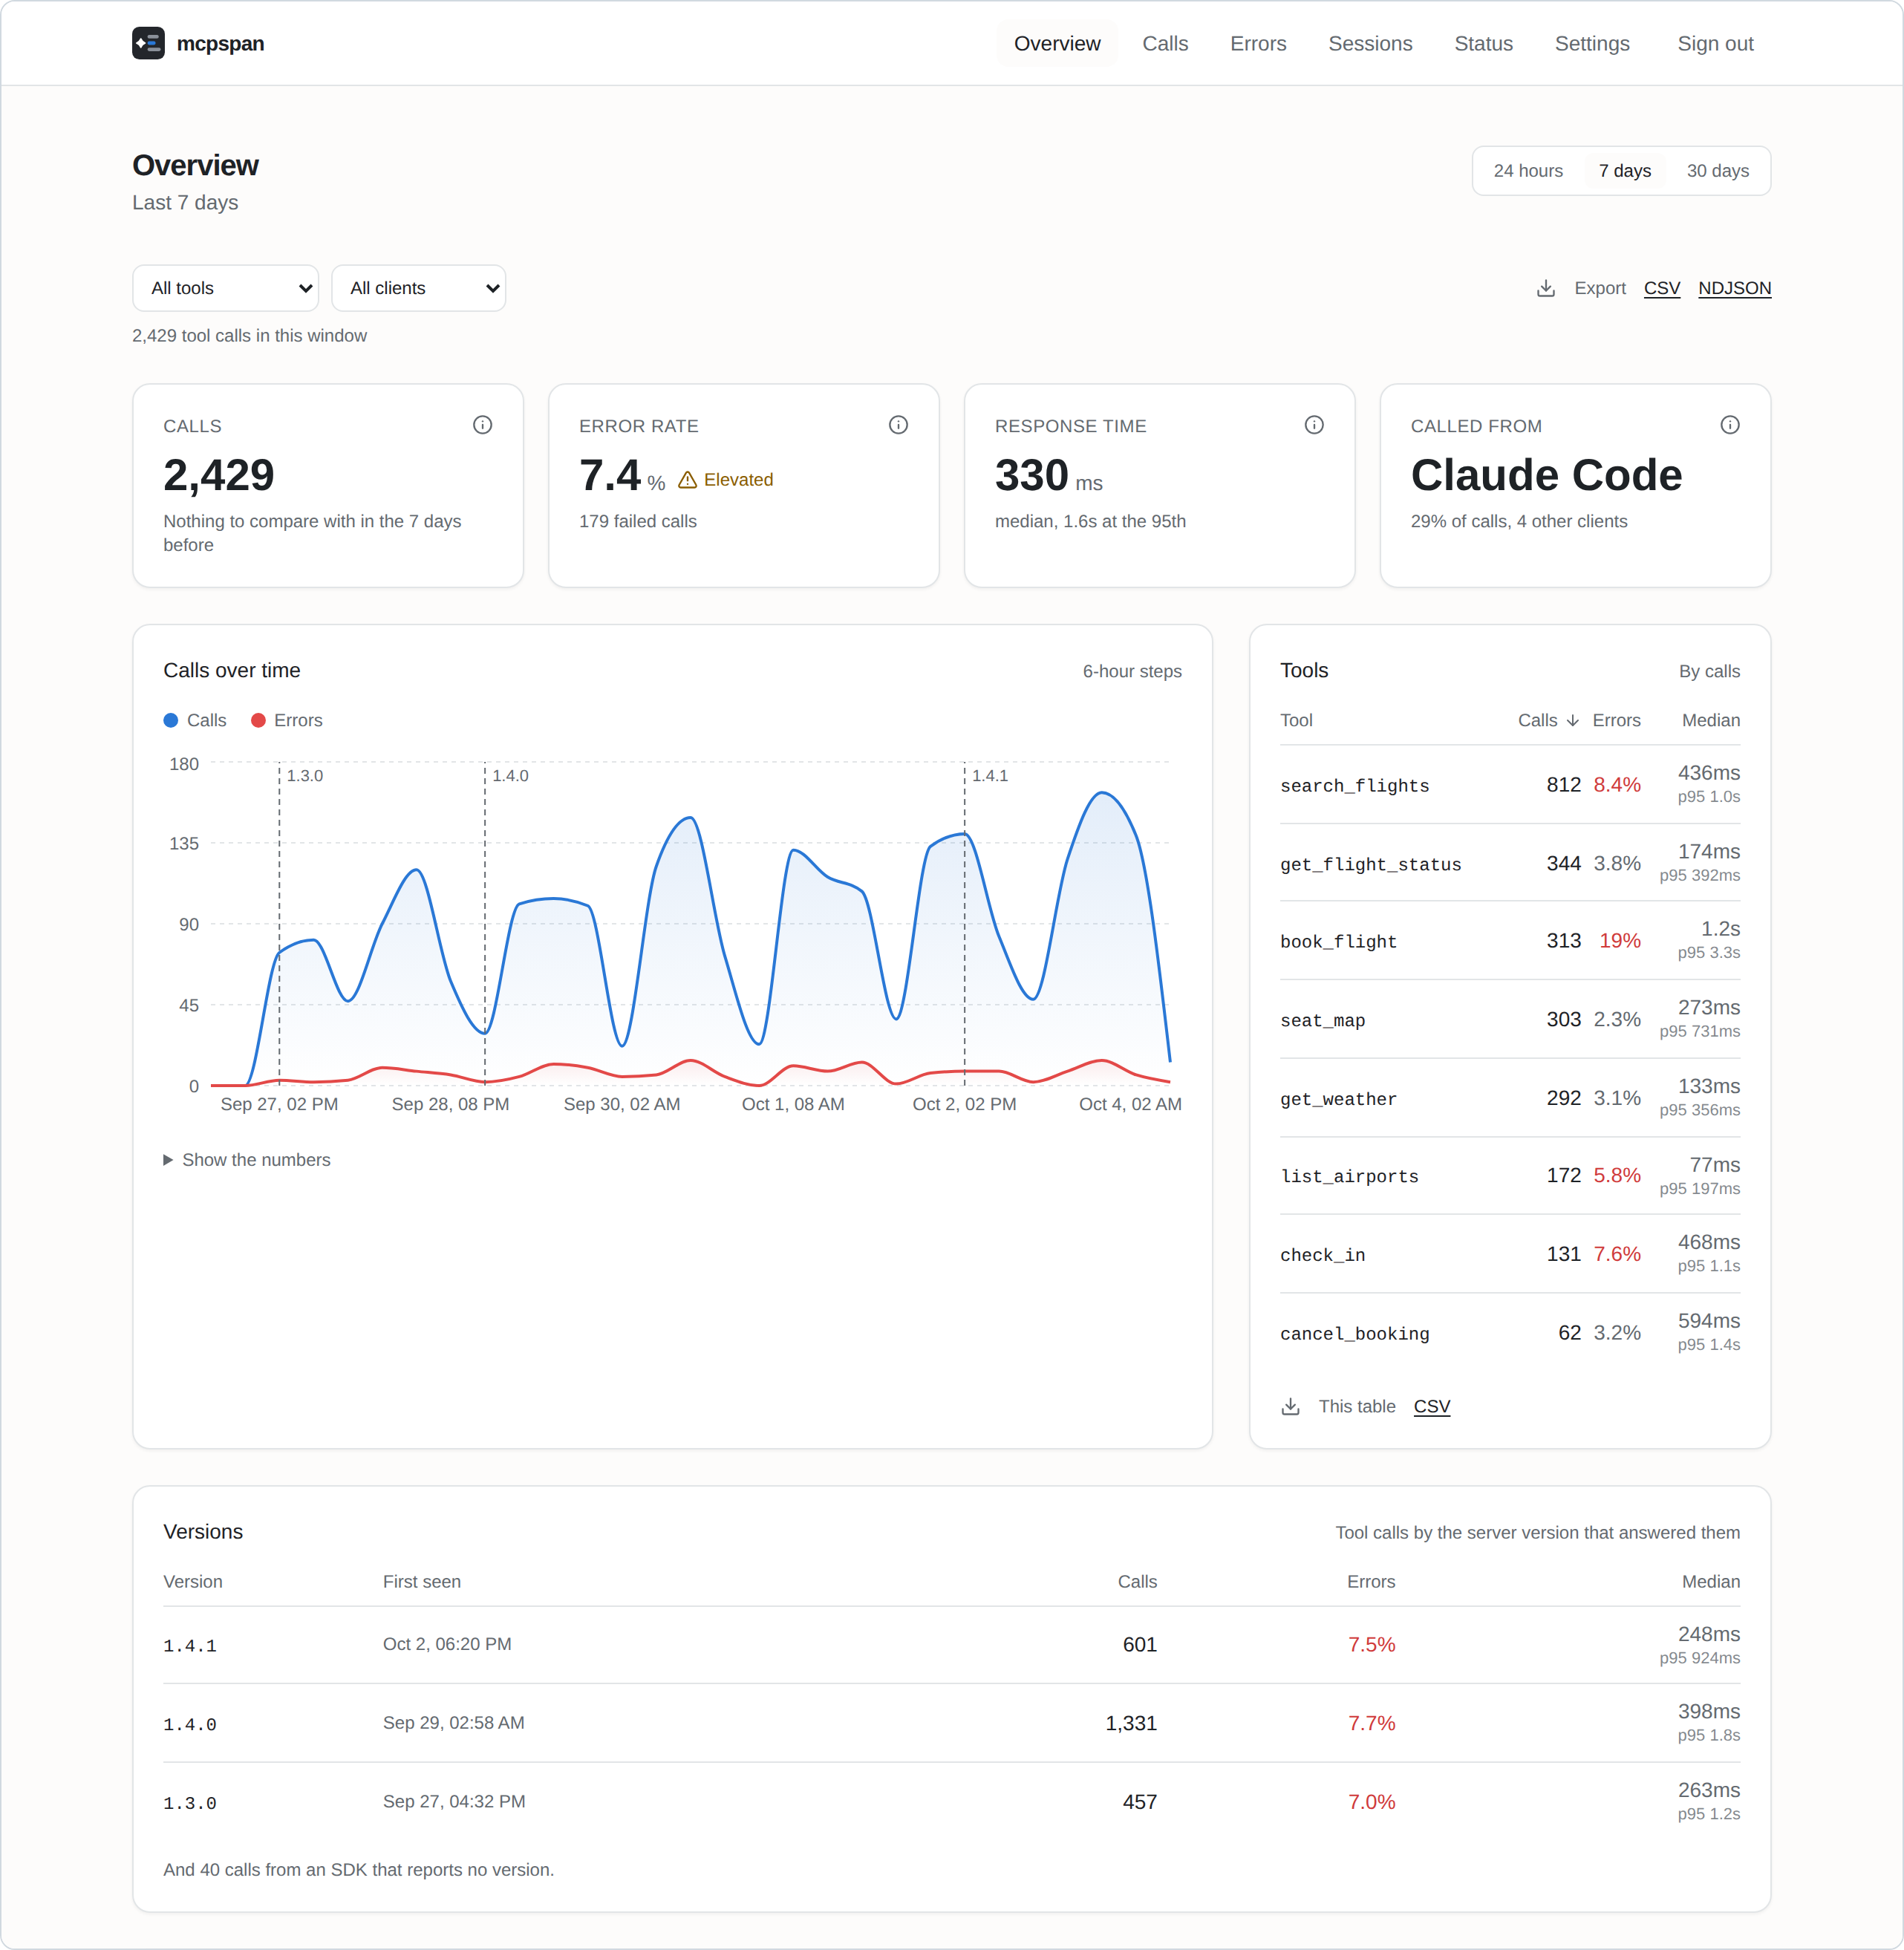
Features
- Every call, from every client. Tool calls, resource reads and prompt gets, with the client that made them: Claude, Claude Code, Cursor, VS Code, Codex, ChatGPT and the rest.
- Response times that mean something. Median and 95th percentile per tool, and the full distribution, so a cache hit and a slow path do not hide inside one average.
- Answer sizes. How large each tool’s answers are, typical and largest: a tool that now and then returns megabytes fills the agent’s context while looking fine on every latency chart.
- What agents are shown. Every session starts by reading the definitions of all your tools, called or not. See how many tokens that list costs, and which tools agents were shown in hundreds of sessions and never called.
- Failures, told apart. A handler that threw, a tool that answered with an error, arguments the server refused and which of them were wrong, and tools that agents asked for but your server does not have: which clients asked, the closest name you do have, and what the agent did next.
- Sessions. Each connection’s calls, step by step, as the agent made them, with the calls an agent repeated with the same arguments marked: a loop that looks fine one call at a time. A tool’s page says which call came right before it repeated or failed, by client.
- Releases. Every call carries the version of your server that answered it; the charts mark where each release began and compare it with the one before. A tool’s own chart also marks where its description or input schema changed, since rewording a description can change how agents use a tool more than a change to its code.
- Alerts to Slack, Discord or any webhook, when errors climb or a server goes quiet, for a whole server or one tool.
- Your data, yours to take. CSV and NDJSON exports of anything you can see, and forwarding to OpenTelemetry for Grafana, Datadog, Honeycomb and the like.
- Private by design. Parameter values never leave your server’s process, and nothing is sent anywhere you did not set up yourself. Error messages, which a tool that runs commands can fill with anything, can be turned off.
설치
npx mcpspan-lint -- node dist/server.js