
A Claude Code skill that gives Claude the ability to capture, inspect, and debug GPU frames using RenderDoc. Works with Vulkan, D3D11, D3D12, and OpenGL.
개요
A Claude Code skill that gives Claude the ability to capture, inspect, and debug GPU frames using RenderDoc. Works with Vulkan, D3D11, D3D12, and OpenGL.
README
renderdoc-skill
A Claude Code skill that gives Claude the ability to capture, inspect, and debug GPU frames using RenderDoc. Works with Vulkan, D3D11, D3D12, and OpenGL.
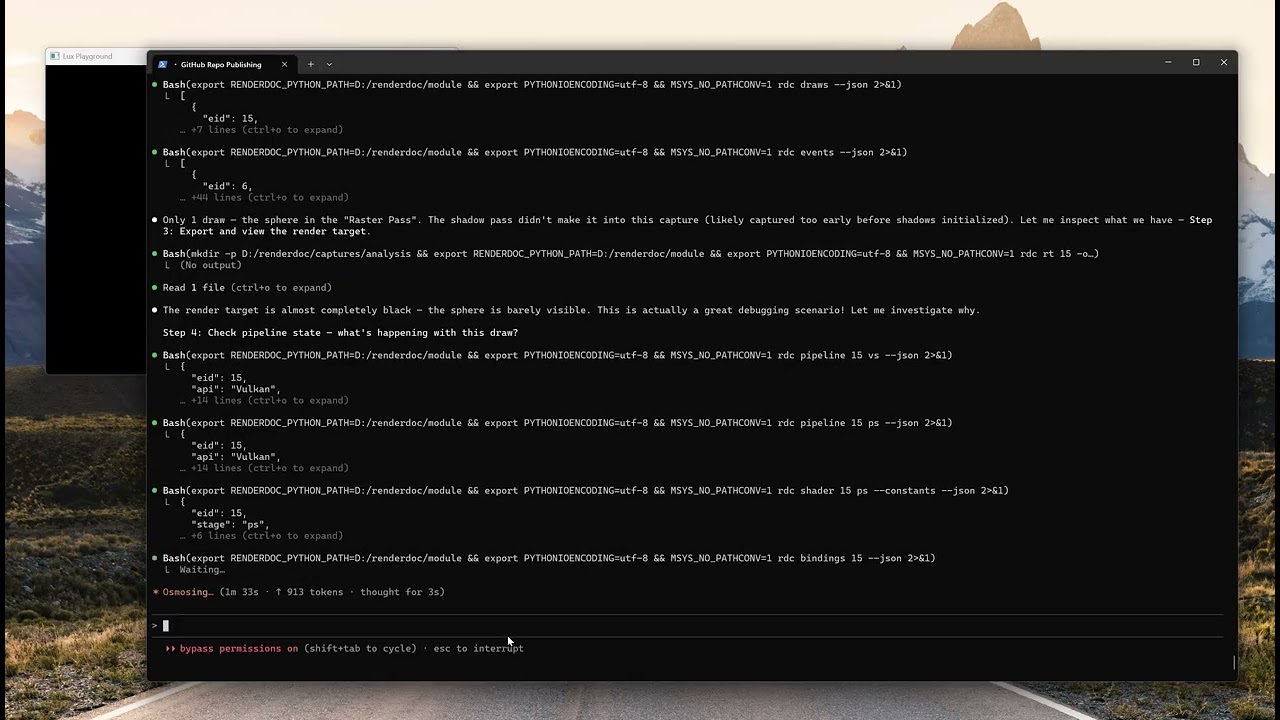
Demo
What This Does
This skill teaches Claude Code how to do GPU debugging. When you describe a rendering problem — broken shadows, wrong colors, missing objects, performance issues — Claude can:
- Capture GPU frames from your application using RenderDoc’s Python API
- Inspect pipeline state at any draw call (shaders, blend, depth, rasterizer, bindings)
- Export and view render targets as PNGs (Claude is multimodal — it can see your framebuffer)
- Debug shaders line-by-line, tracing pixel/vertex/compute execution
- Trace pixel history to find which draw wrote a color and why
- Edit and replay shaders without recompiling your application
- Compare frames side-by-side to find regressions
It works through rdc-cli, a 66-command CLI that wraps RenderDoc’s Python API into shell commands that Claude Code can call.
Prerequisites
| Requirement | Notes |
|---|---|
| RenderDoc | Need renderdoc.pyd + renderdoc.dll (from RenderDoc install or built from source) |
| Python 3.10+ | Must match the Python version renderdoc.pyd was built against |
| rdc-cli | pip install rdc-cli |
| Claude Code | Anthropic’s CLI agent |
Installation
1. Clone this repo into your project
# Option A: Clone into your project directory
cd /path/to/your/project
git clone https://github.com/rudybear/renderdoc-skill .claude/skills/renderdoc-gpu-debug

# Option B: Clone standalone and copy the skill files
git clone https://github.com/rudybear/renderdoc-skill
cp -r renderdoc-skill/.claude/skills/renderdoc-gpu-debug /path/to/your/project/.claude/skills/
2. Install rdc-cli
pip install rdc-cli
3. Set up RenderDoc module path
Set RENDERDOC_PYTHON_PATH to the directory containing renderdoc.pyd and renderdoc.dll:
# In your shell profile (.bashrc, .zshrc, etc.)
export RENDERDOC_PYTHON_PATH=/path/to/renderdoc/module
If you installed RenderDoc from the official installer, this is typically:
- Windows:
C:/Program Files/RenderDoc/ - Linux:
/usr/lib/renderdoc/or wherever you built it
4. Register the Vulkan layer (Vulkan apps only)
For Vulkan capture, the RenderDoc implicit layer must be registered:
- Windows: Add
renderdoc.jsontoHKCU\SOFTWARE\Khronos\Vulkan\ImplicitLayers(DWORD 0) - Linux: Copy
renderdoc.jsonto~/.local/share/vulkan/implicit_layer.d/
Also set: export ENABLE_VULKAN_RENDERDOC_CAPTURE=1
5. Verify
rdc doctor
All checks should pass.
6. Customize CLAUDE.md
Edit the CLAUDE.md in this repo to fill in your project-specific paths (application executable, working directory, capture output directory). This tells Claude about your specific setup.
MCP Server (Alternative Installation)
Instead of (or in addition to) the skill, you can use the MCP server. This registers rdc-cli as native Claude Code tools that appear in /mcp.
1. Install the MCP dependency
pip install -r requirements-mcp.txt
2. Register with Claude Code
claude mcp add rdc-tools -- python D:/renderdoc/mcp_server/server.py
3. Verify
In Claude Code, run /mcp — you should see rdc-tools listed with 13 tools, 2 resources, and 6 prompts.
Available tools
| Tool | Commands | Purpose |
|---|---|---|
rdc_session |
open, close, status | Session lifecycle |
rdc_overview |
info, stats, passes, count, gpus | First-look after opening |
rdc_draws |
draws, draw | Draw call navigation |
rdc_events |
events, event | API event listing |
rdc_pipeline |
pipeline, bindings | Pipeline state inspection |
rdc_shader |
shader, shaders, search, shader-map | Shader inspection |
rdc_export |
rt, texture, thumbnail, mesh, buffer | Visual export (inline image + path) |
rdc_pixel |
pixel, pick-pixel, debug pixel/vertex/thread | Pixel debugging |
rdc_diff |
diff | Frame comparison |
rdc_resources |
resources, resource, usage, tex-stats | Resource inspection |
rdc_shader_edit |
shader-build/replace/restore/encodings | Edit-replay |
rdc_capture |
capture, attach, trigger, list, copy | Frame capture |
rdc_vfs |
ls, tree, cat | Virtual filesystem |
rdc_command |
any rdc command | Generic fallback |
How It Works
Skill trigger
Claude Code loads skills based on YAML frontmatter keywords. When you mention GPU debugging, RenderDoc, shaders, render targets, pipeline state, or visual glitches, Claude activates this skill and gains access to the full rdc-cli command vocabulary.
Session lifecycle
Every inspection session follows open-work-close:
rdc open path/to/capture.rdc   # Load a capture
# ... inspection commands ...
rdc close                       # Release GPU resources
Visual inspection pattern
Claude can see images. The core debugging loop is:
- Export a render target or texture to PNG (
rdc rt EID -o output.png) - View it using Claude Code’s Read tool (multimodal — Claude sees the image)
- Correlate with pipeline state data (
rdc pipeline,rdc shader,rdc bindings) - Diagnose the issue and suggest fixes
Included debugging recipes
The skill includes 6 ready-made debugging workflows:
- Object is invisible — culling, depth, blend, vertex transform checks
- Colors are wrong — texture bindings, constants, blend state, shader trace
- Shadows are broken — shadow map export, depth bias, light matrices, PCF
- Performance is bad — draw counts, resource sizes, overdraw, GPU counters
- What changed between frames — frame diff with visual comparison
- Debug this pixel — pixel history, shader trace, variable inspection
File Structure
.claude/skills/renderdoc-gpu-debug/
  SKILL.md                          # Main skill (loaded by Claude Code)
  references/
    commands-quick-ref.md           # All 66 rdc-cli commands with args/options
    debugging-recipes.md            # 6 extended debugging workflows

CLAUDE.md                           # Project context (customize for your app)
capture_frame.py                    # Example: capture a frame via RenderDoc Python API
Example Usage
Once installed, just talk to Claude Code naturally:
> The shadows in my scene look blocky and have acne artifacts. Can you debug it?

> Capture a frame and show me what the shadow map looks like.

> Why is the sphere rendering black? It should be red.

> Compare these two captures and tell me what changed.

> Debug pixel (256, 300) — why is it transparent?
Claude will use rdc-cli commands, export PNGs to inspect visually, check pipeline state, and trace shader execution to diagnose the issue.
Acknowledgments
- rdc-cli by Jim (BANANASJIM) — the 66-command CLI that makes this skill possible. MIT license.
- RenderDoc by Baldur Karlsson — the GPU debugger that powers everything underneath. MIT license.
- Claude Code by Anthropic — the AI coding agent that runs the skill.
License
MIT. See LICENSE.
추천 도구
다른 키워드를 입력하거나 필터를 제거해 보세요.
설치
npx skillfish add rudybear/renderdoc-skill